Body inputs, fit recommendation, and garment preview states.
Back to work
Interactive Unity prototype
SizeCompare
3D fit visualization research tied to sizing confidence, returns, and retail conversion risk.
At a glance
SizeCompare tests whether body-based fit visualization can make sizing decisions easier to understand than chart interpretation alone.
Prototype build, comparison task, data analysis, and business framing.
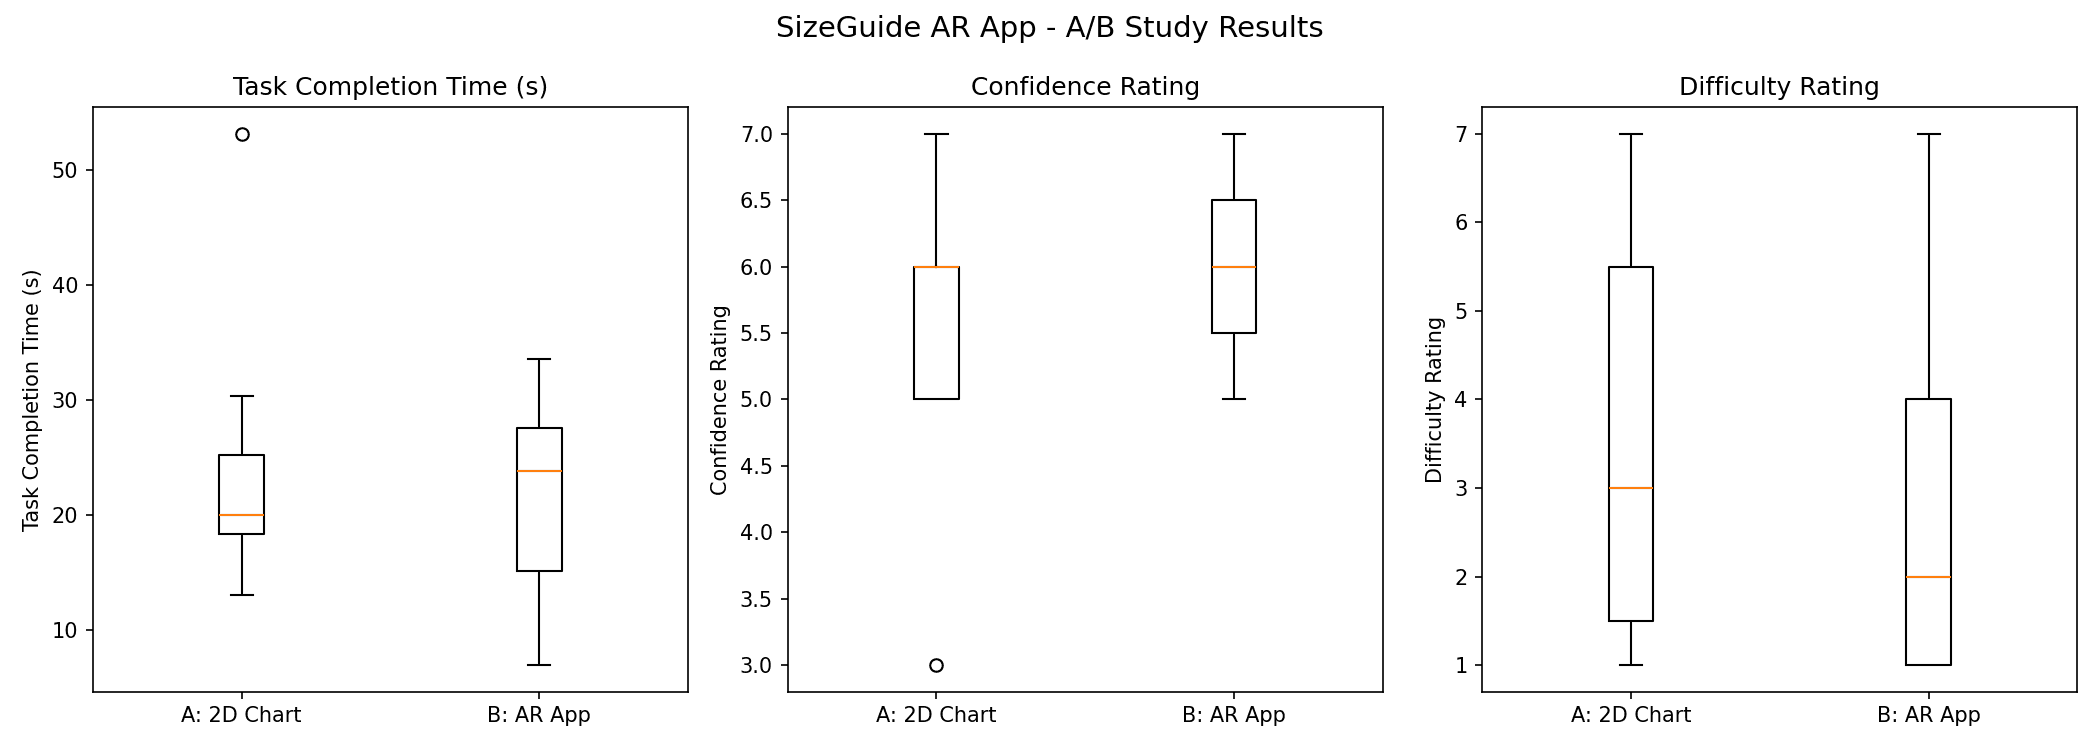
Reported difficulty dropped in the app condition.
Confidence rose from 5.43 to 6.00 in a small comparative study.
Blender assets, usability testing, and statistical analysis.
Problem
Sizing charts ask users to translate abstract numbers into fit expectations. SizeCompare tests whether body-based comparison can make size selection easier to understand.
Why this matters
- Sizing failures are often interpretation failures, not just missing measurements.
- Users need to understand fit tradeoffs, not only receive a size label.
- A body-based preview can make abstract garment dimensions easier to reason about.
Design challengeHow might sizing guidance move from chart interpretation to body-based fit understanding?
System model
How the system moves
01
Measure
Collect user body inputs through onboarding.
02
Recommend
Map body profile to hoodie size guidance.
03
Preview
Show fit through a Unity garment prototype.
04
Evaluate
Compare task time, confidence, and difficulty against chart-based selection.
Design evolution
A chart-interpretation problem became a fit-feedback prototype.
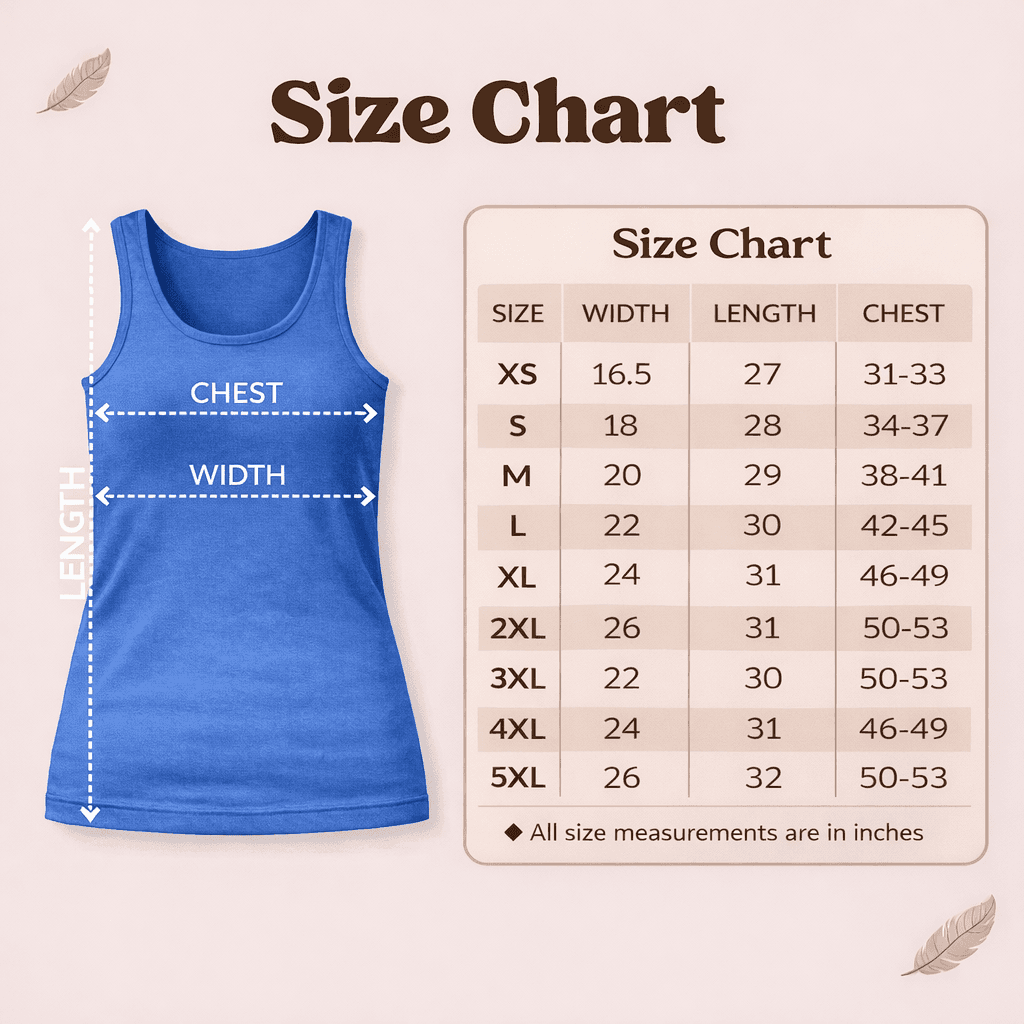
Static size chart
The conventional path asks shoppers to translate garment dimensions into a predicted fit.
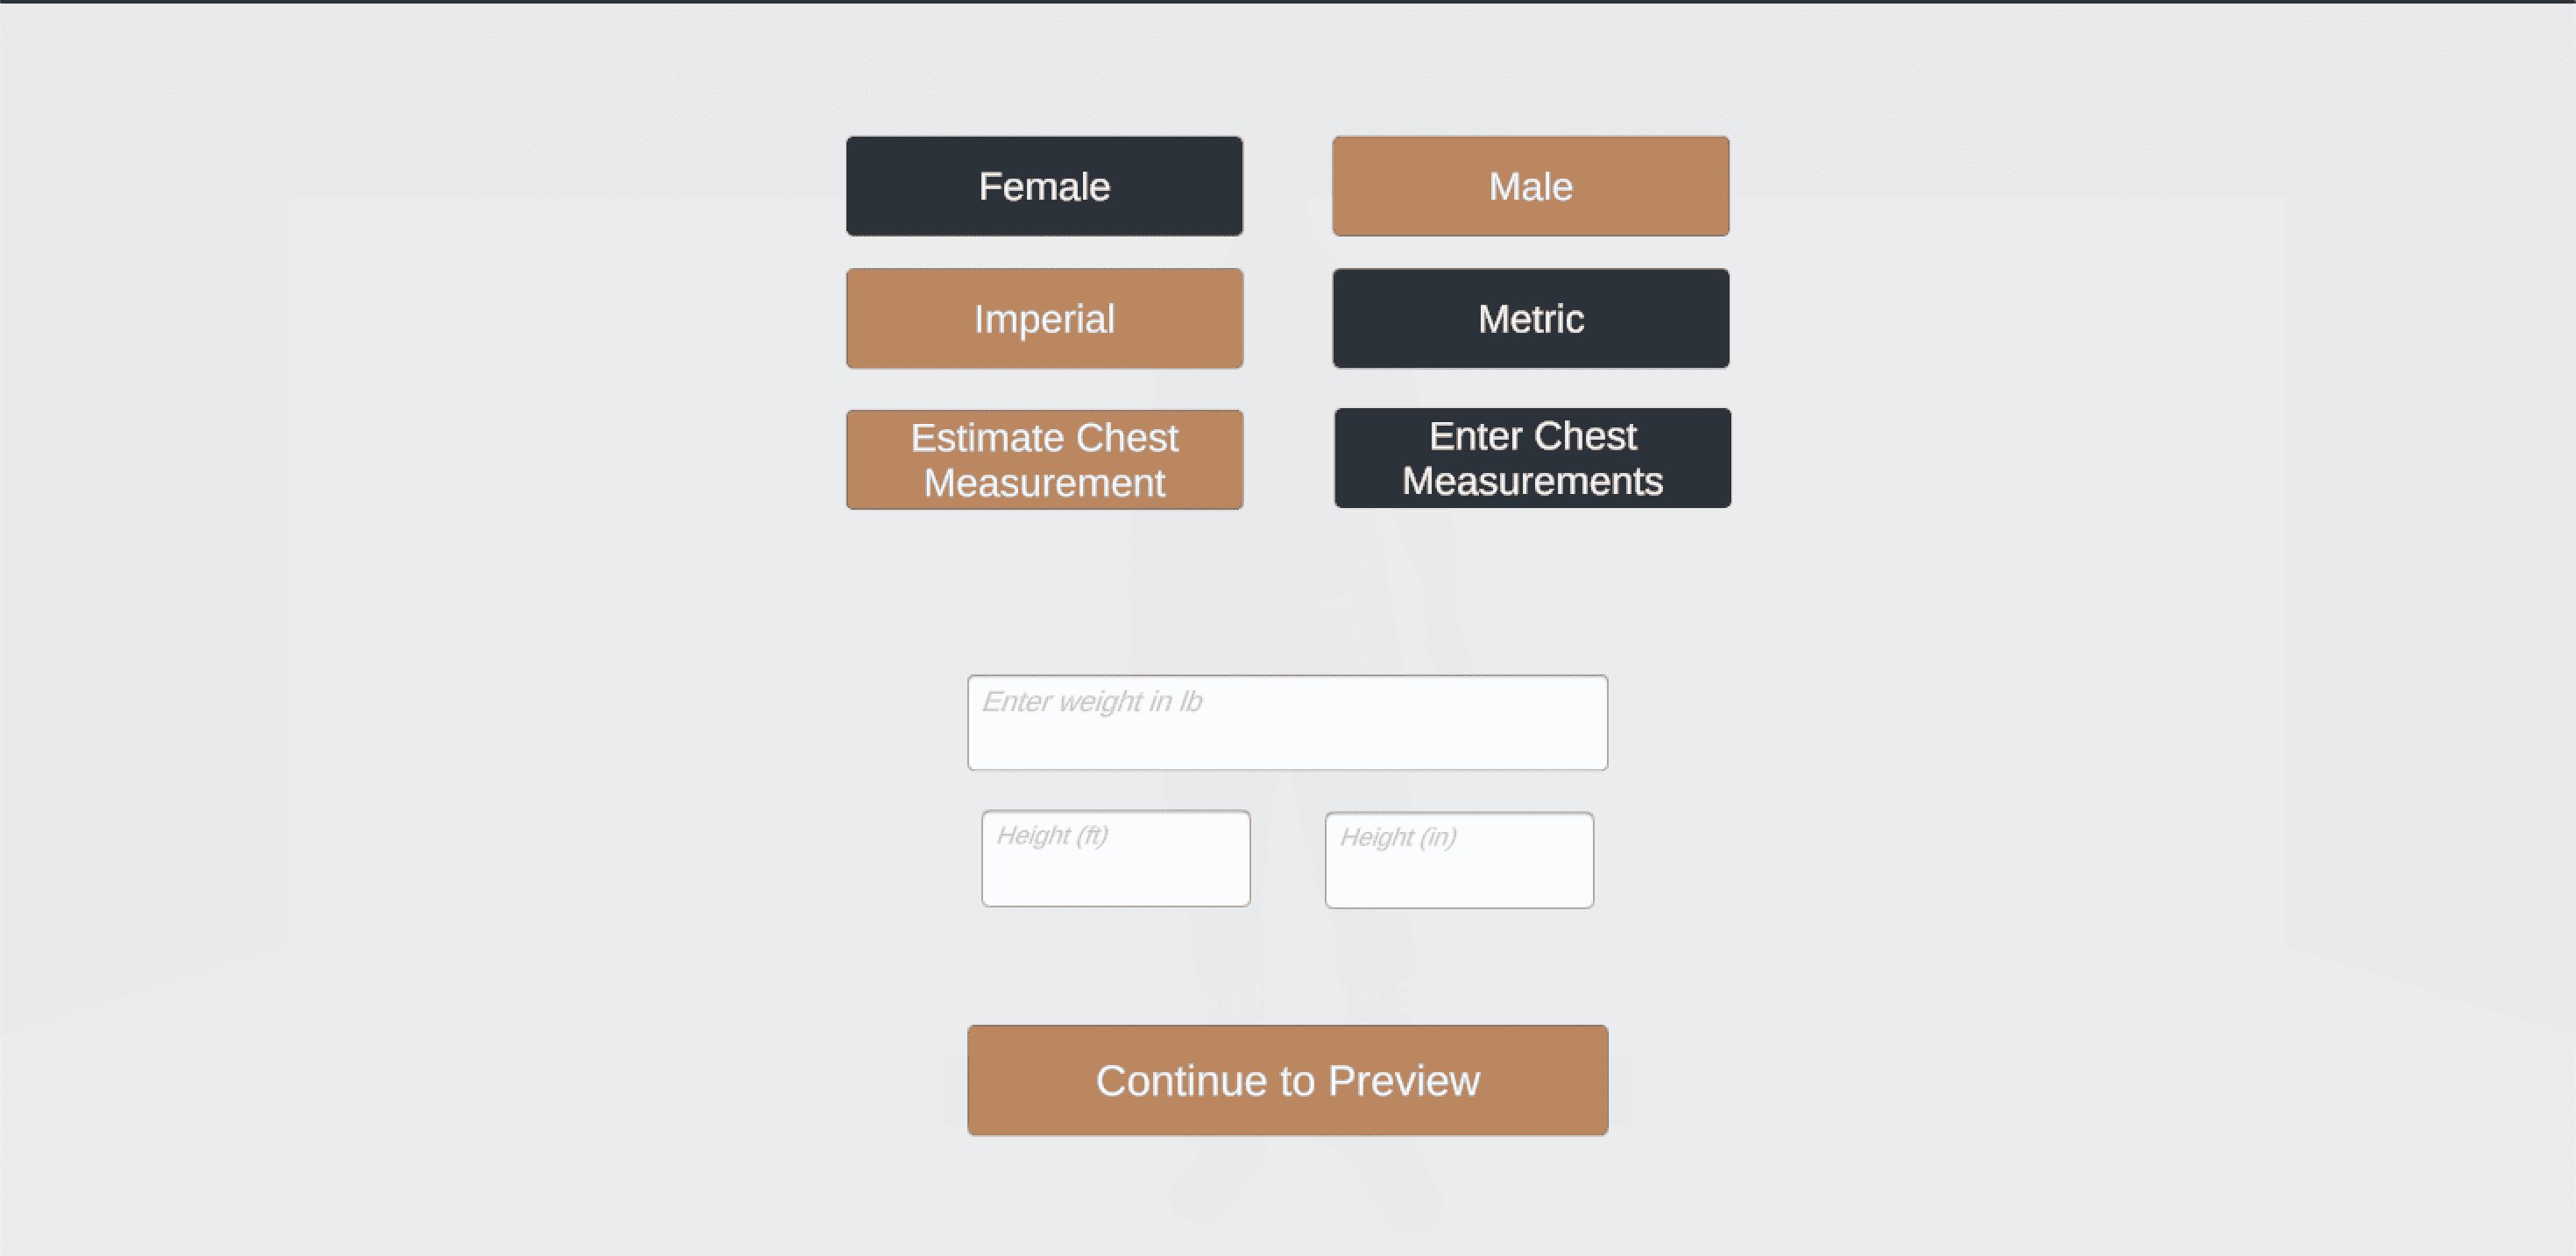
Body profile setup
An early Unity screen tested the minimum inputs needed to drive a personalized preview.
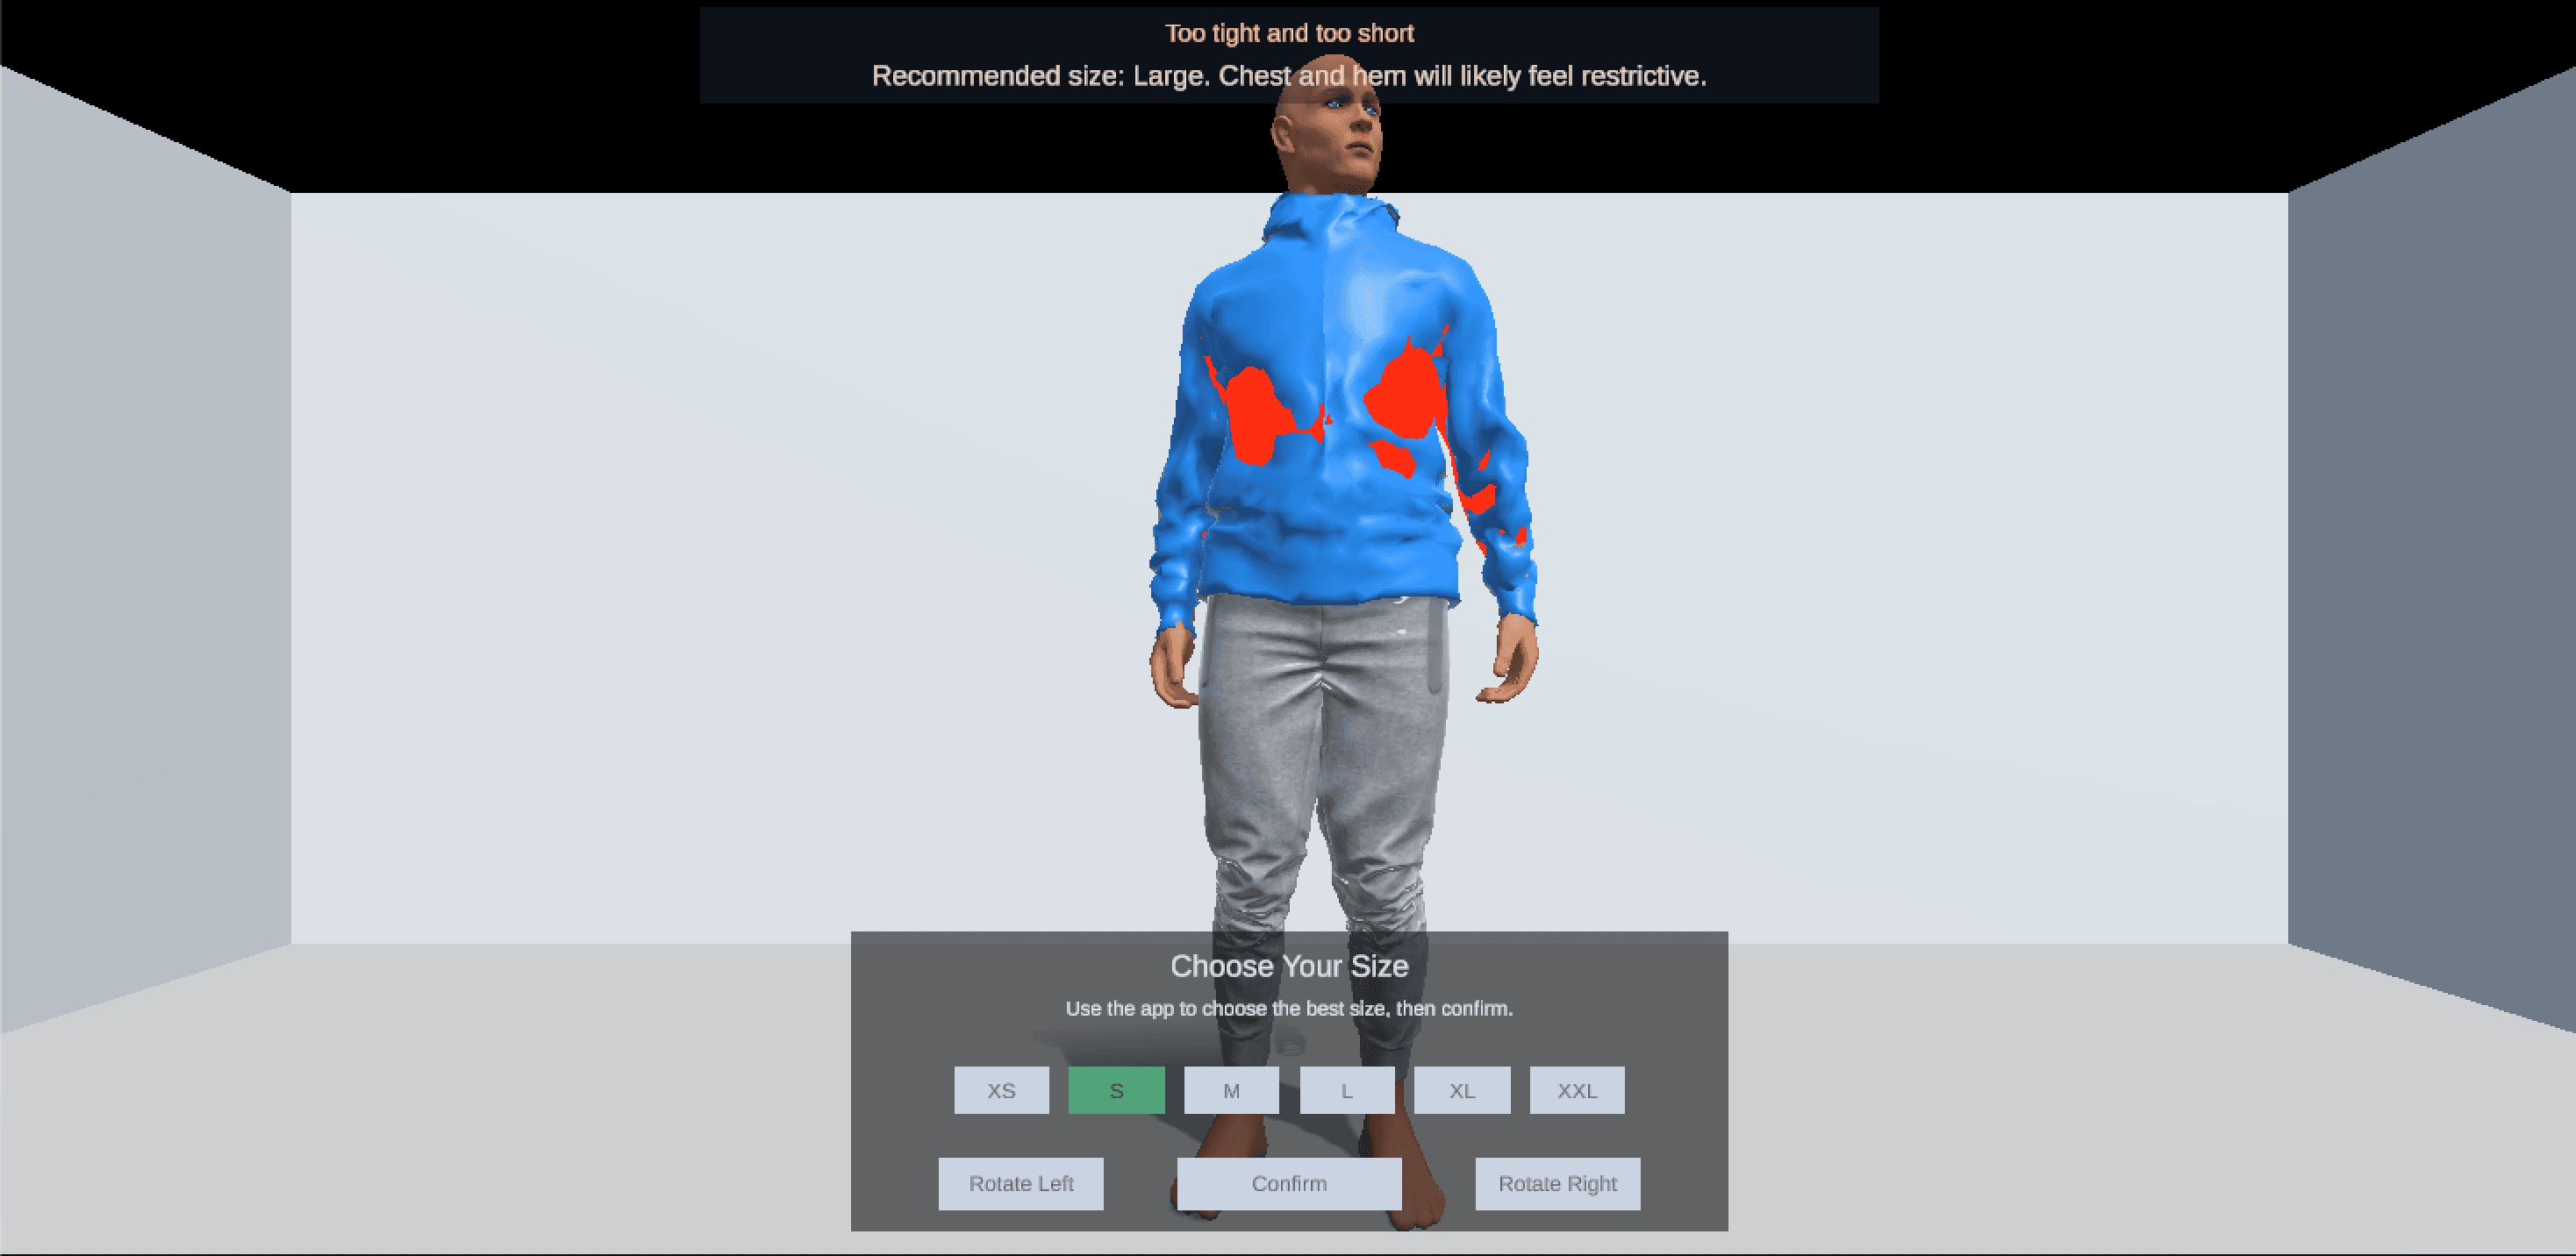
Embodied fit feedback
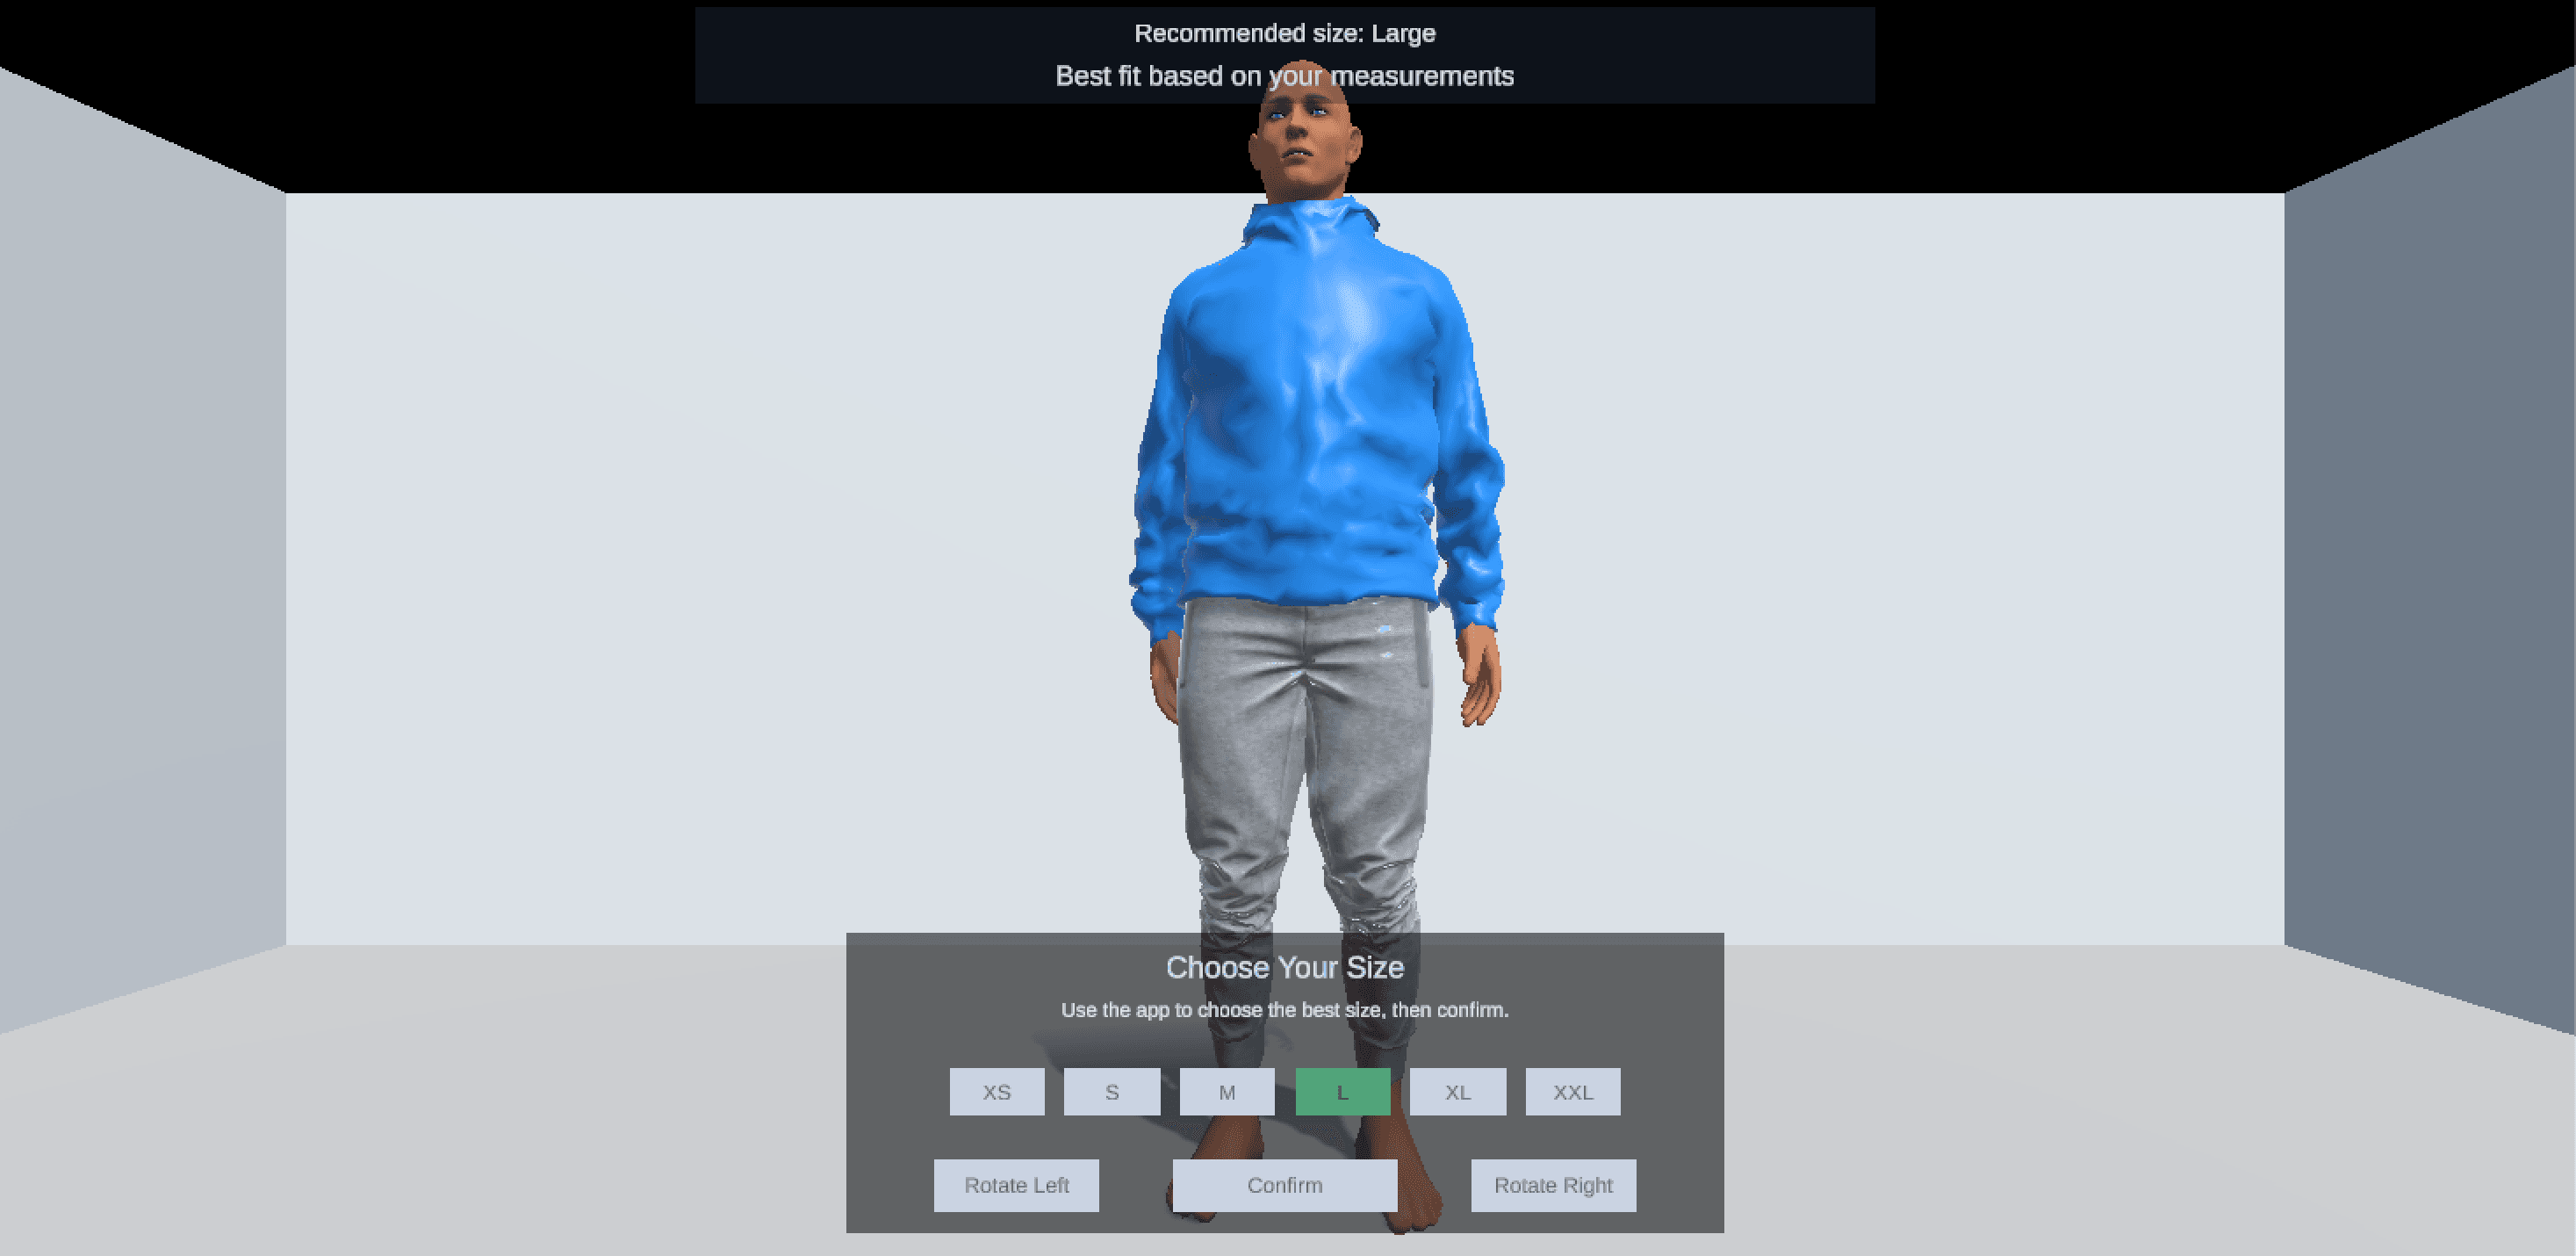
The study prototype made garment fit visible and paired it with a size recommendation.
Process artifacts
The evidence is in the comparison between chart logic and embodied fit.
I treated fit selection as both an interpretation problem and a retail decision problem. The prototype compared a traditional chart against an embodied visualization path, then connected prototype signals to ecommerce risks like hesitation, incorrect-size purchases, and returns.
Size chartNumbers to interpret
Embodied previewFit to reason about
Difficulty3.57 -> 2.86
Confidence5.43 -> 6.00
Revised analysis excluding the accuracy metric.
Business framing
The prototype addressed a retail problem as well as a user confidence problem.
Avoidable fit-related returns modeled for a $100M apparel brand scenario.
Returns attributed to size and fit issues in the business framing.
Online clothing return-rate range used to frame the ecommerce risk.
Projected annual savings if AR try-on reduced return pressure.
These are projected business implications, not measured deployment results. The study metrics are prototype signals: confidence, difficulty, task time, and sizing uncertainty.
ConfidenceAdd-to-cart confidence / purchase conversion
DifficultyReduced confusion / lower support friction
Task timeNo added shopping friction
Size switchingIntervention in uncertain decisions
Fit warningsFewer incorrect-size purchases
What shaped the system
Sizing needed to become easier to reason about.
Compare chart logic against embodied preview
Decision: Test a body-based visualization against the conventional sizing chart flow.
Tradeoff: The study stays exploratory, but it produces clearer evidence around confidence and perceived difficulty.
Keep garment shape authored
Decision: Use authored hoodie shape inputs and let Unity own runtime skinning.
Tradeoff: More asset preparation, but a more reliable user-facing fit preview.
Design walkthrough
How the prototype compares chart interpretation with embodied fit feedback.
Measurement onboarding
Collects enough body information to generate a fit recommendation.
User problem
Moves users away from interpreting a static chart alone.
Design response
The runtime path was stabilized around fixed hoodie prefabs and blend-shape switching.
Embodied comparison
Pairs avatar-based visualization with fit guidance so the user can compare what the recommendation means.
User problem
Makes size interpretation more concrete than a measurement table.
Design response
The project shifted from showing a size answer to showing why the answer may feel plausible.
Study comparison
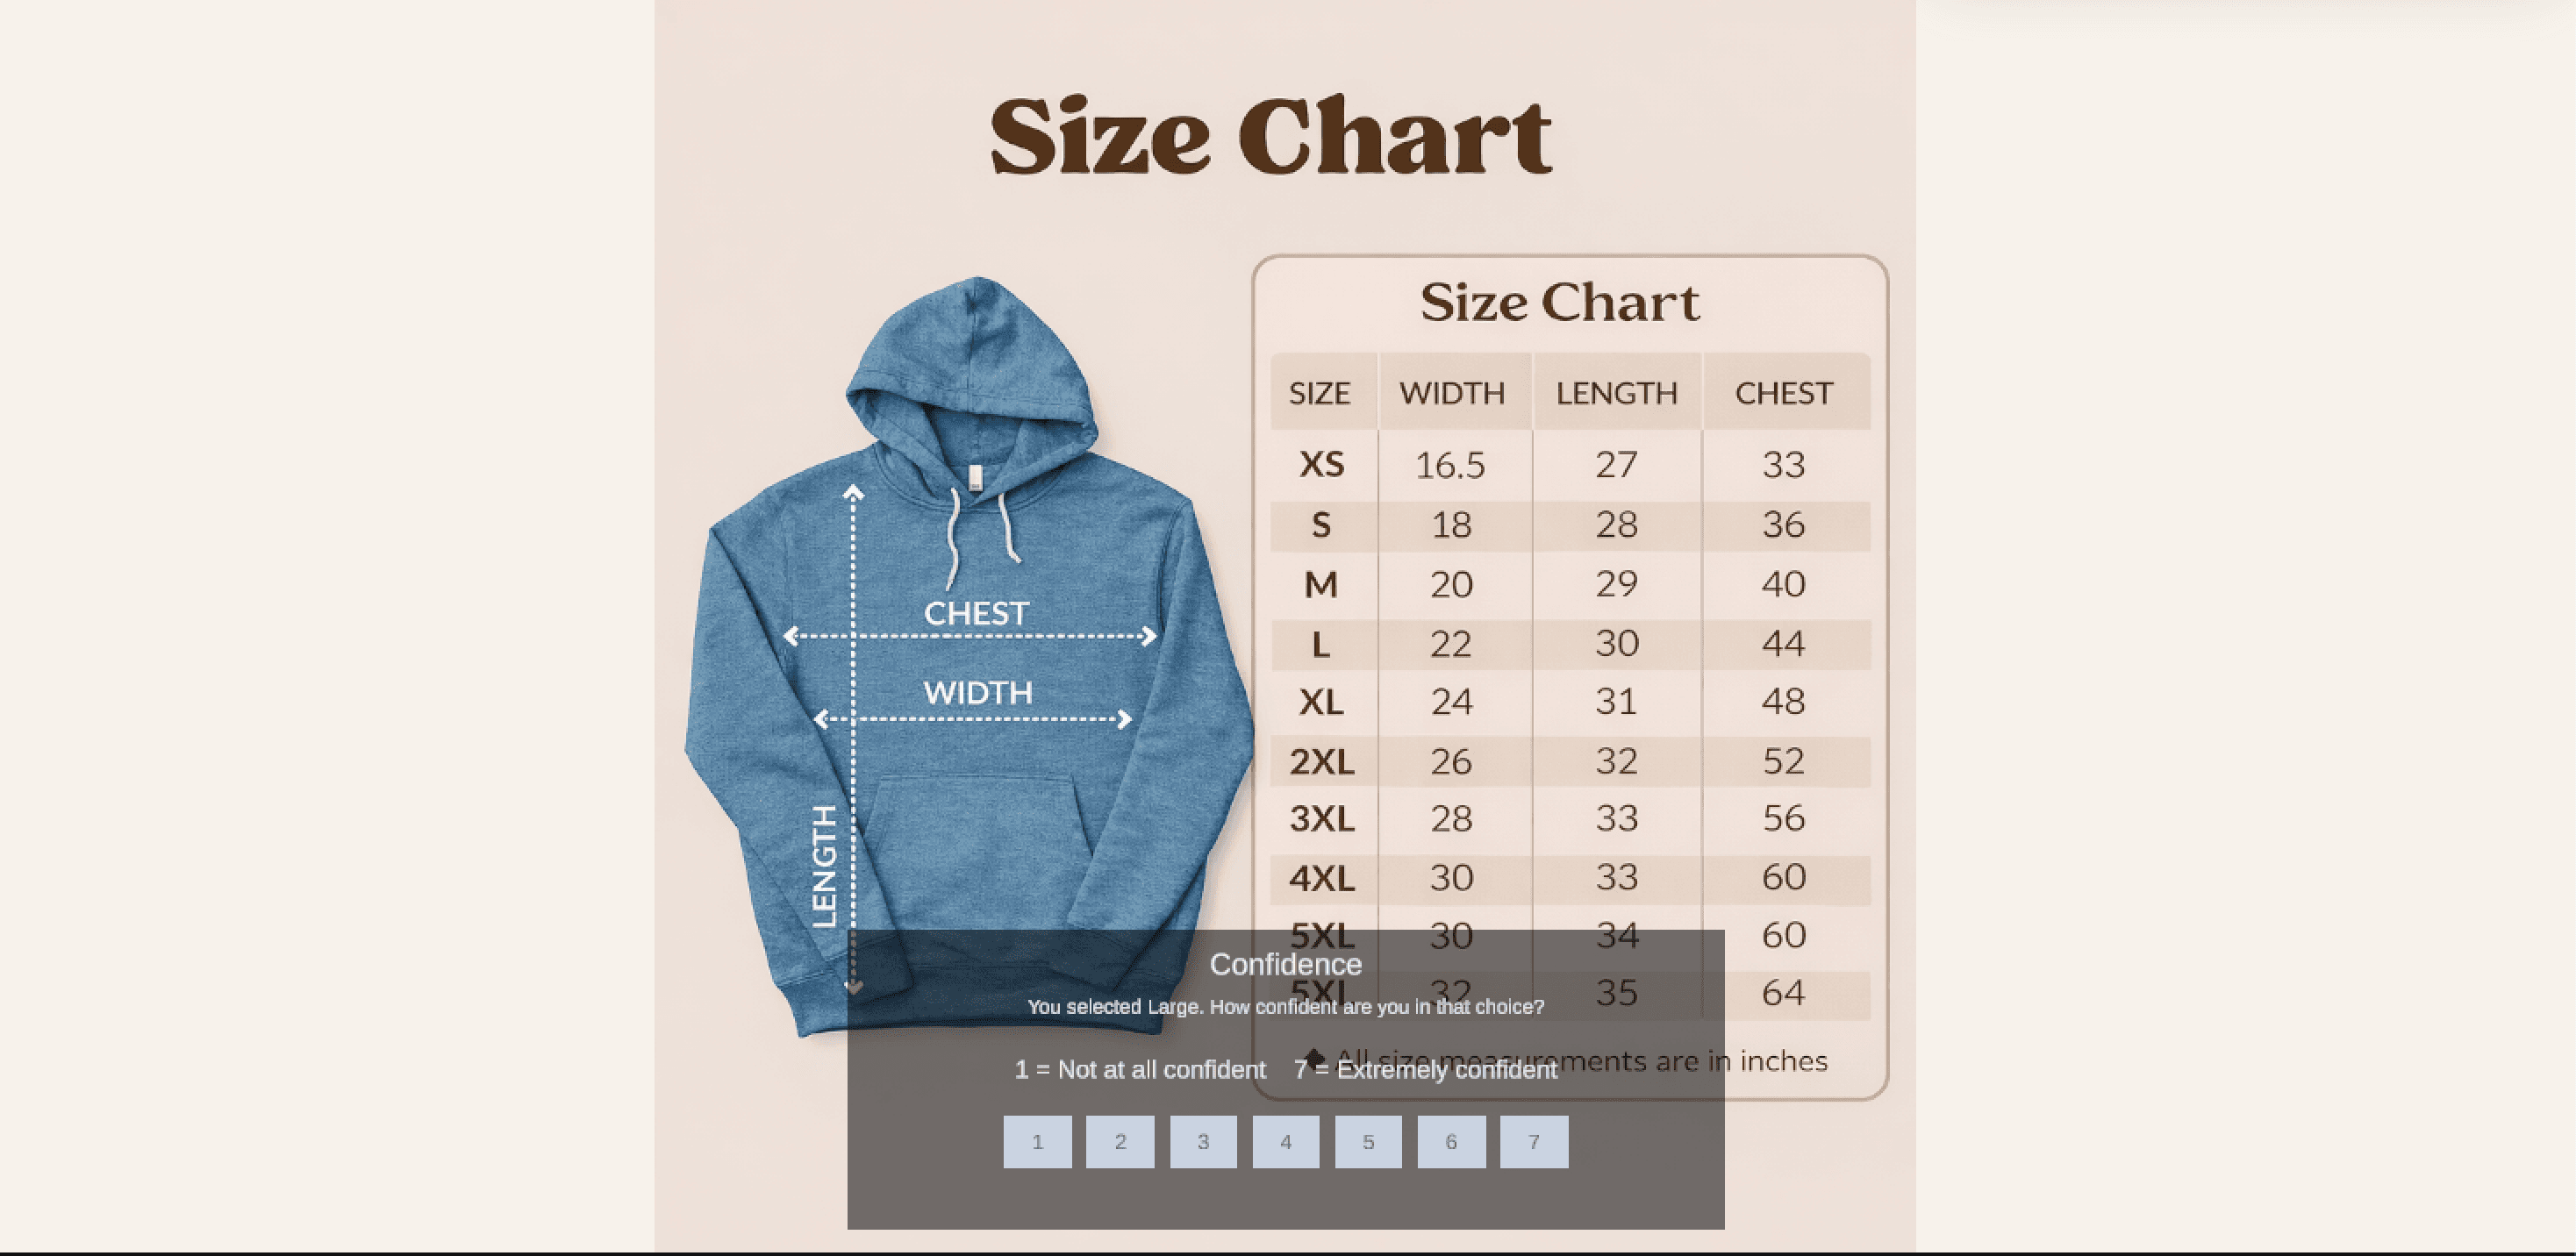
Compares chart-based selection against the Unity app flow.
User problem
Tests whether the prototype improves decision quality and confidence.
Design response
The current analysis uses a revised analysis excluding the accuracy metric.
Research / testing
Compare size-selection performance and confidence between a chart and the app prototype.
Small A/B usability study with task time, confidence, and difficulty measures.
TaskTime: chart 24.81s vs app 21.43s in the revised analysis.
Confidence: chart 5.43 vs app 6.00.
Difficulty: chart 3.57 vs app 2.86.
The app condition appeared strongest as a confidence and interpretation aid, not as proof of universal sizing accuracy.
The portfolio framing treats the results as exploratory evidence about embodied sizing support, not a universal sizing claim.
Outcome
A Unity prototype and comparative study showing lower reported difficulty, with business framing around fit uncertainty, return risk, and ecommerce decision confidence.
The study is small, but the artifact shows end-to-end product thinking from sizing logic to evaluation.
Reflection
What this project sharpened.
The study is small, but the artifact shows end-to-end product thinking from sizing logic to evaluation.
The strongest next step is tightening the garment visual fidelity and rerunning with a larger sample.
The useful insight is that fit UX needs to support interpretation, not only calculation.